This is one of the common issue developer faces when they try to debug the azure webiste. In order to debug the Azure website from your local machine you should attach the debugger to your website. This “Attach Debugger” option will be visible in your server explorer. Lets us see how you can reach there first.
In order to debug the Azure website remotely first you have to open Server Explorer from the View menu. Once you click on the Server Explorer just expand the Windows Azure section. If you are not logged in to Azure account It may prompt you to login. Once you connect to your Windows Azure account you will be able to see all your websites which is already hosted in your Azure account.
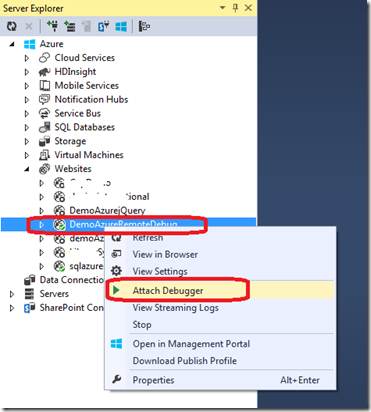
Here I have created a new website for demo purpose. To remote debug your Azure website, you have to right click on your application then you will find “Attach Debugger” option.
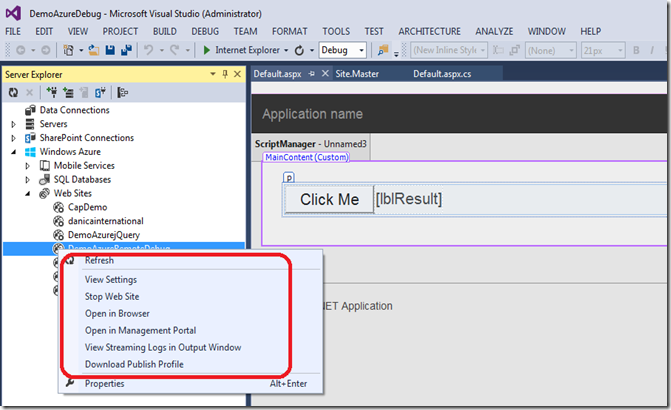
But in below screen print you can see that “Attach debugger” option is missing.

The reason for not seeing “Attach Debugger” option is I haven’t installed the latest Azure SDK. You can download the Azure SDK using the link Azure SDK. The basic requirement install the Azure SDK is you may require Visual 2013 update 3 or above. If you try to install without Update 3 or above installation may fail.
Once you install the Azure SDK you may have to re-start your system. After rebooting the system open your visual Studio –>View—>Server Explorer—>Azure—>Websites—>Right click on the application which you wanted to remote debug. You will find the “Attach debugger” option.

I hope your issue with Attach debugger is resolved! Next I will be writing how to debug Azure website remotely.
In order to debug the Azure website remotely first you have to open Server Explorer from the View menu. Once you click on the Server Explorer just expand the Windows Azure section. If you are not logged in to Azure account It may prompt you to login. Once you connect to your Windows Azure account you will be able to see all your websites which is already hosted in your Azure account.
Here I have created a new website for demo purpose. To remote debug your Azure website, you have to right click on your application then you will find “Attach Debugger” option.
But in below screen print you can see that “Attach debugger” option is missing.

The reason for not seeing “Attach Debugger” option is I haven’t installed the latest Azure SDK. You can download the Azure SDK using the link Azure SDK. The basic requirement install the Azure SDK is you may require Visual 2013 update 3 or above. If you try to install without Update 3 or above installation may fail.
Once you install the Azure SDK you may have to re-start your system. After rebooting the system open your visual Studio –>View—>Server Explorer—>Azure—>Websites—>Right click on the application which you wanted to remote debug. You will find the “Attach debugger” option.

I hope your issue with Attach debugger is resolved! Next I will be writing how to debug Azure website remotely.

No comments:
Post a Comment